Everything an SRE does,
on every cluster, all the time.
One agent in your cluster turns scattered telemetry into a live map, autonomous investigations, a multi-cloud cost ledger, and pre-investigated incidents — all self-hosted. Shipped capabilities below, organized by what you actually do with them.
Live topology
Physics-laid graph of namespaces, workloads, services and dependencies, with health + spend on every node.
Knowledge graph
Cause-and-effect graph persisted across investigations — every fix teaches the next.
Real-time deltas
WebSocket stream of topology changes with change-attribution (deploy / config / runtime).
eBPF observability
Kernel-level traffic + syscall visibility for the services that don't emit metrics.
Service mesh
Istio + Linkerd + Cilium aware — request paths and policy traffic in the same view.
Multi-cluster federation
One model across EKS / GKE / AKS / k3s / on-prem. Cross-cluster dependencies surfaced.
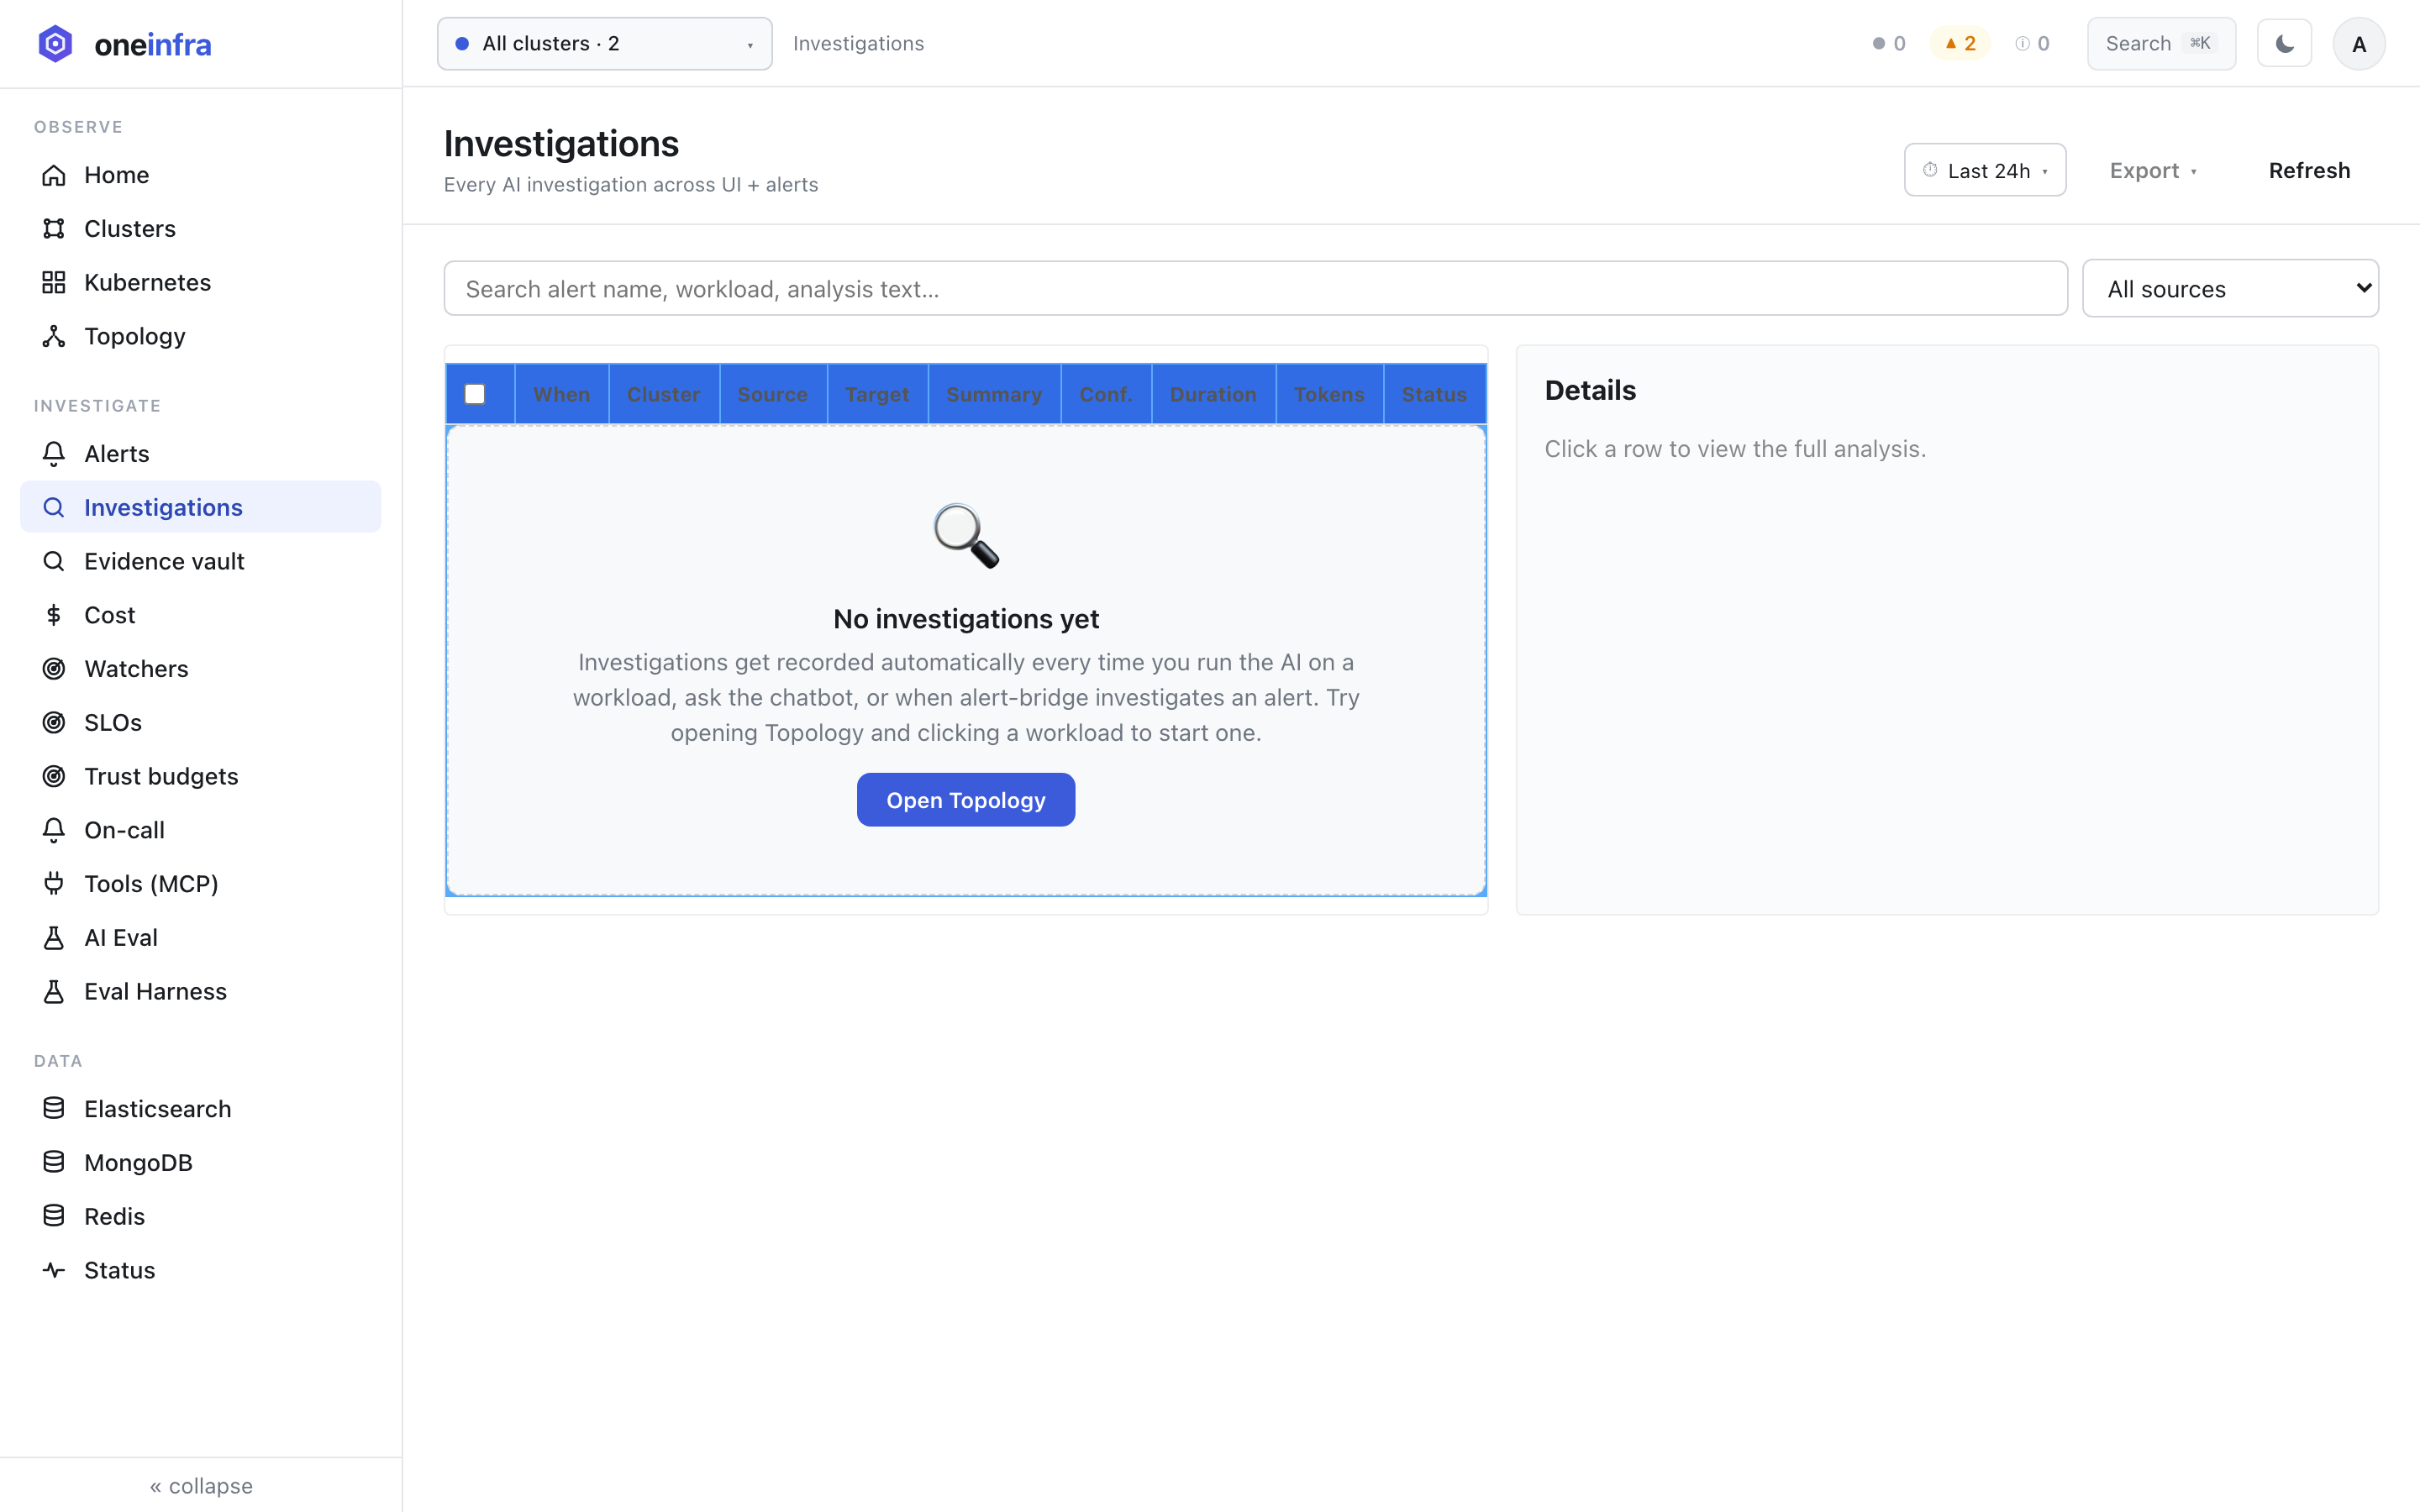
AI investigations
Reasons across logs, metrics, traces, events, deploys, config — returns root cause with evidence.
BlastRadius DAG
Cytoscape-rendered graph of what else is at risk when the finding lands.
Investigation Workbench
Three-column UI: AI analysis · pinned evidence (frozen) · markdown scratchpad (auto-saved).
Post-mortem auto-gen
"Generate post-mortem" composes investigation + actions + evidence + notes into a ready-to-paste doc.
Thread tree
Follow-up investigations link to parents; the full incident graph is one click away.
Verifier reranker
AI quality gate — second-pass agent re-ranks low-confidence answers before they surface.
OpenCost allocation
Per-namespace, per-workload allocation with idle %, waste in dollars, projected monthly spend.
Multi-cloud billing
AWS Cost Explorer + GCP Billing (BigQuery) + Azure Cost Management unified in one view.
Cost anomaly detection
Watcher fires on new spend before the invoice does. 7-day baseline, severity-aware.
Right-sizing PRs
"Ask AI" on any row produces an exact resource recommendation and opens the PR.
Pre-investigated alerts
Every Prometheus / Alertmanager alert arrives with root cause + evidence pre-attached.
AI alert suppression
Severity-aware grouping cuts noise without dropping the signal underneath.
Slack threaded replies
One thread per incident; the agent posts updates as it works.
Native incident sinks
PagerDuty, Opsgenie, incident.io — first-class. No webhook stitching.
Pyrra-native SLOs
SLO definitions written straight into the cluster as CRDs. No separate tool.
Burn-rate watchers
Fire on trajectory toward breach, not after the budget is gone.
Trust budgets
Per-workload trust scores gate when auto-actions can fire vs requiring approval.
Federated SLOs
Per-cluster + per-namespace + cross-cluster rollups for the whole org.
Eval Harness
Continuously measures investigation quality against a seed eval set as your env changes.
OTLP audit log
Every action emitted as a standard OpenTelemetry span — pipes into your existing audit stack.
Evidence vault
Every investigation, query, and finding retained for audit and post-incident review.
Bring-your-own LLM
OpenAI / Anthropic / AWS Bedrock / Azure / self-hosted. Switch with one config line.
Predeploy assessor
Blocks risky deploys with a pre-flight check across telemetry + change history.
Connect-your-stack wizard
Guided MCP onboarding for the long tail of tools the AI should be able to query.
Built for clusters, not bolted on.
Every signal is pre-correlated with Kubernetes identity — pod, namespace, deployment, owner. The AI reasons in the same units your team does.
- Multi-cluster, namespace-aware from day one
- Deploy-aware: ties regressions to the commit and PR that caused them
- Direct views into Elasticsearch, MongoDB, Redis and Kafka
- Helm install · no sidecars · no SDKs · runs in your VPC
Speaks the stack you already run
Native adapters for the obvious tools, MCP for everything else. Wire a custom adapter in under an hour.
Put an AI SRE on every cluster.
See oneinfra investigate a live incident, surface idle spend, and draft a fix — in a 20-minute walkthrough on your stack.