Your Kubernetes,
investigated.
Triage incidents to root cause in <60s, surface 73% of idle spend on day one, and draft the fix as a pull request — across every cluster, from one console. Self-hosted, runs in your VPC, bring-your-own model.
No demo call needed — the live app is one click away.
Works with the stack you already run
Observe, investigate, and cut cost
without stitching five tools together
Most teams run one tool to watch, another to debug, and a spreadsheet for spend. oneinfra does all three on the same context.
Every cluster, one map
Live topology, Kubernetes state, and seven signals correlated out of the box. No SDKs, no per-service instrumentation.
Learn moreAI that finds root cause
Click any workload — or let the alert-bridge act for you. Agents reason across logs, metrics, deploys and config to the line that broke.
Learn moreSee — and kill — waste
OpenCost-style allocation flags every starving and wasteful workload, with idle %, projected spend, and the fix.
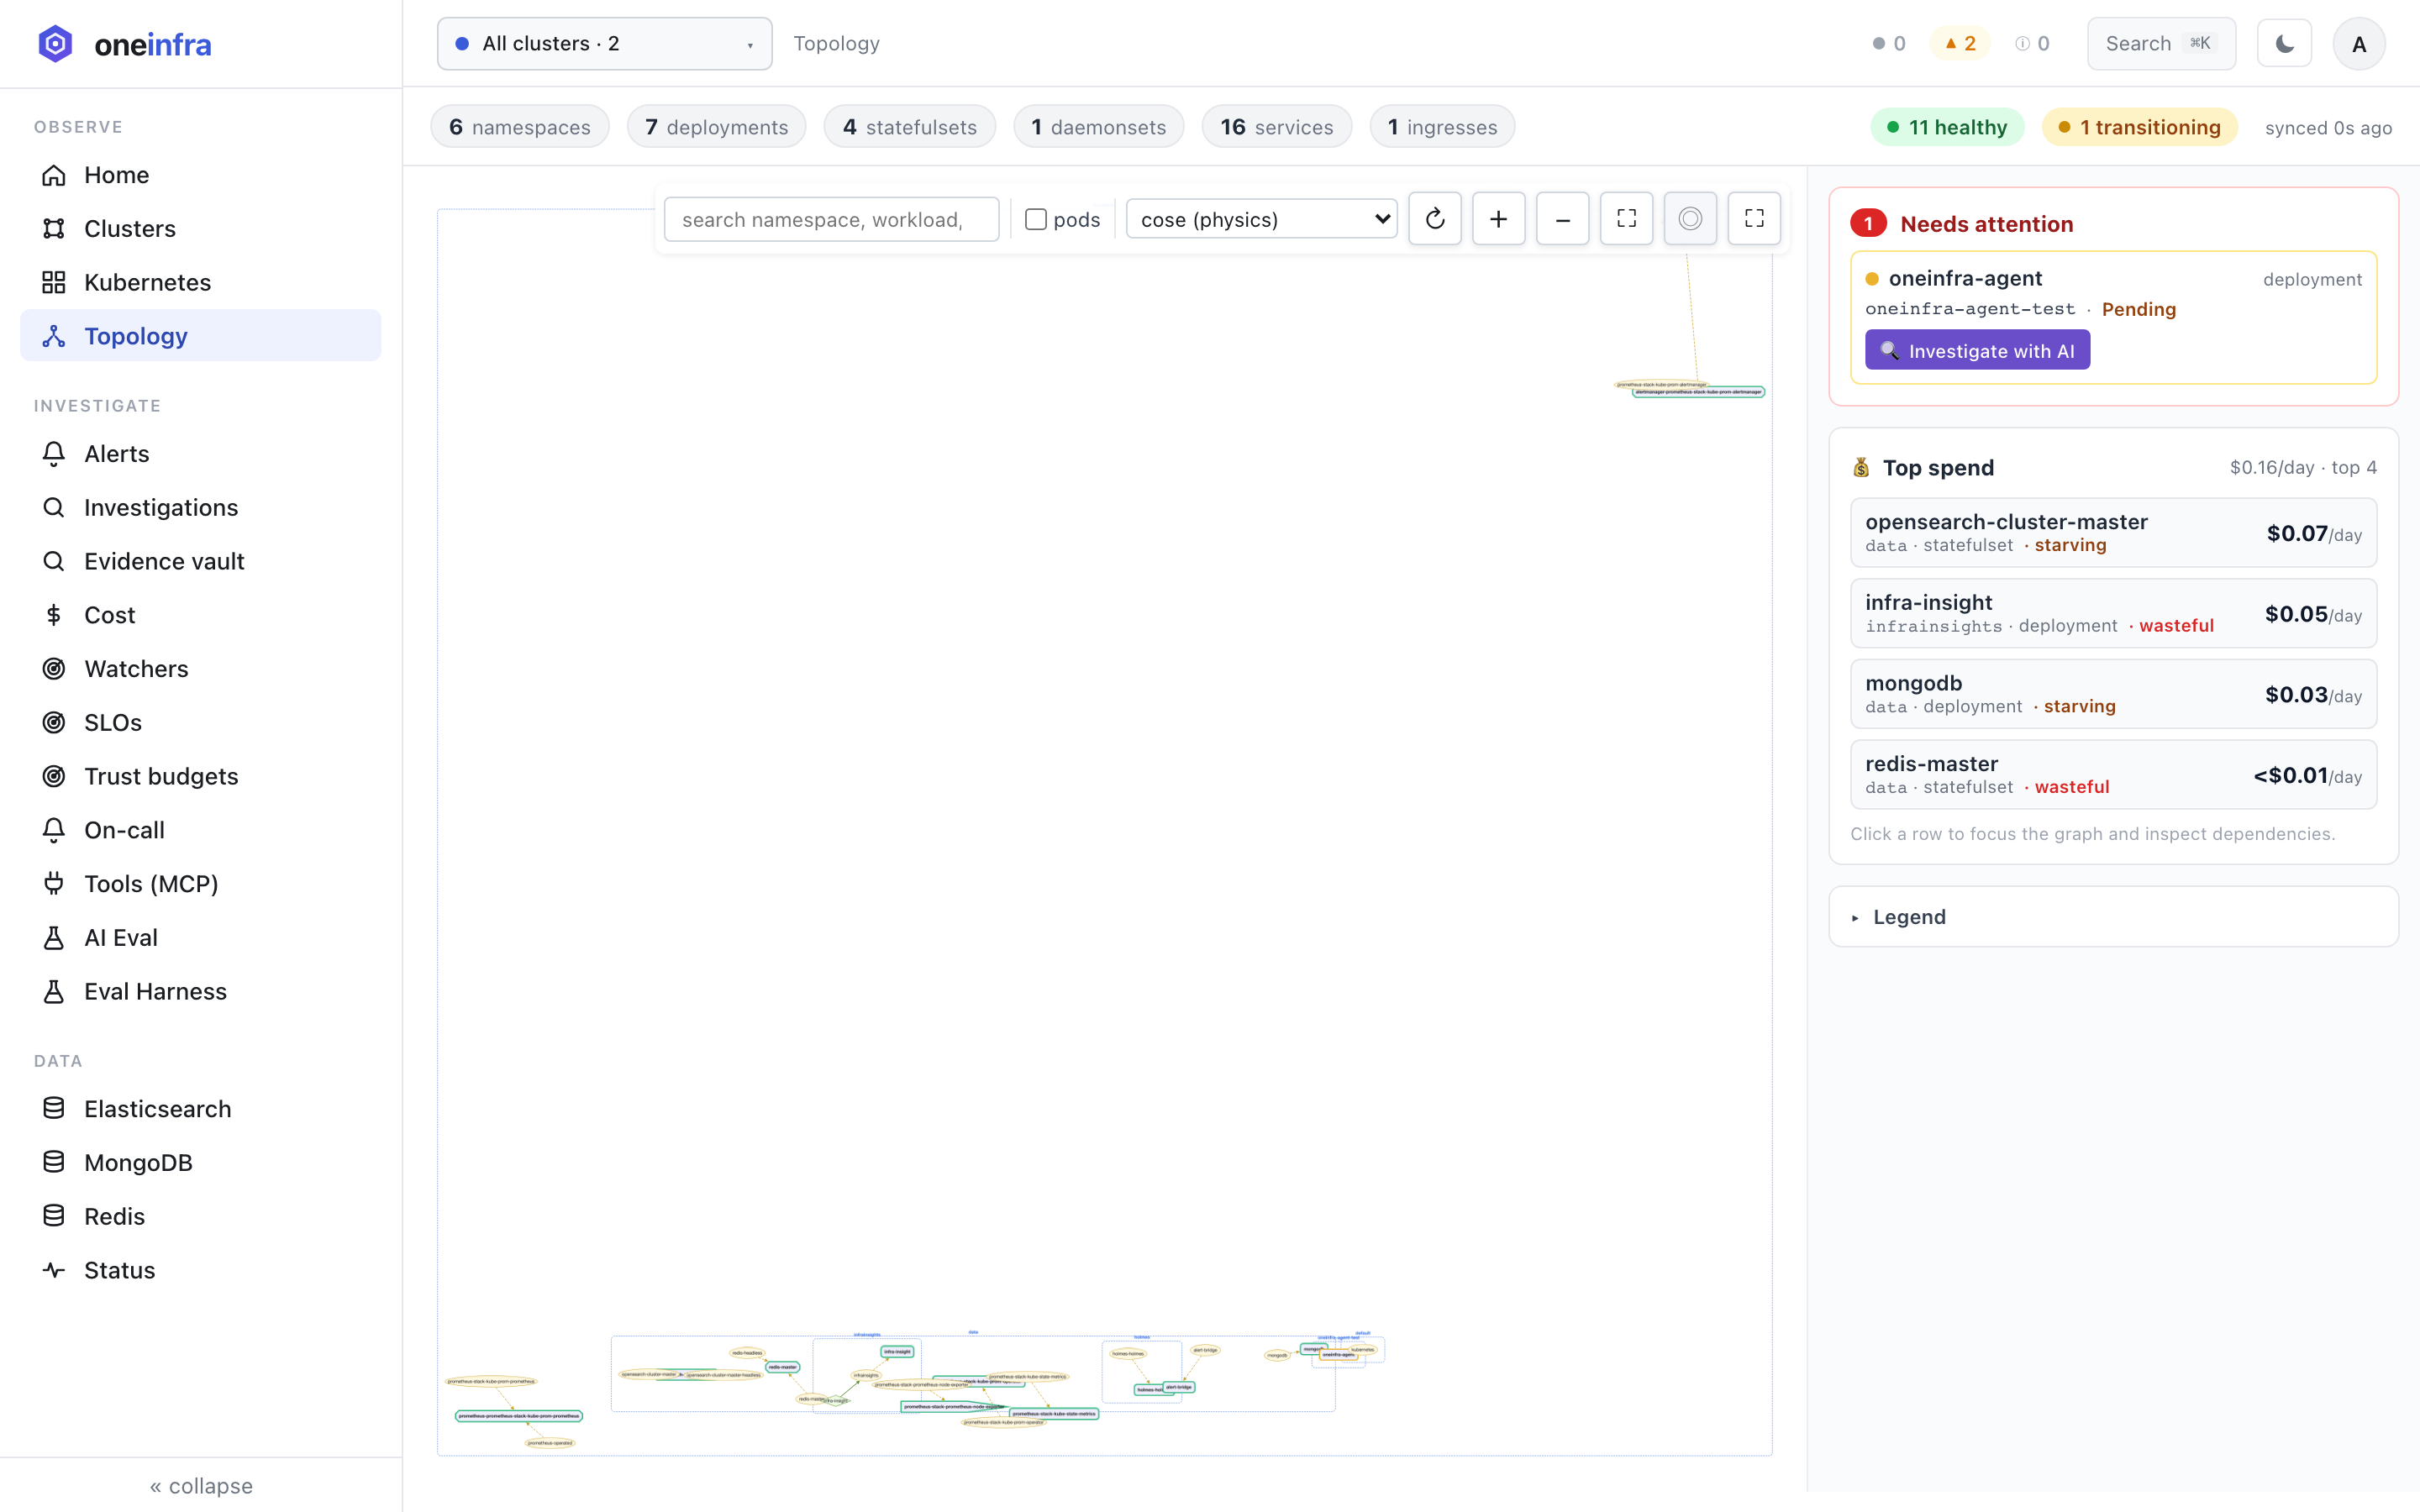
Learn moreClick a workload. Get the root cause.
From the live topology graph, fire an AI investigation on anything that looks off — or let the alert-bridge do it the moment an alert fires. Every investigation is recorded with its evidence, confidence, and the fix.
- Reasons across logs, metrics, traces, events, deploys and config
- Returns root cause with linked evidence — not just a symptom
- Opens a draft fix PR or runs a guarded remediation
- Every run logged in the Evidence vault for post-incident review
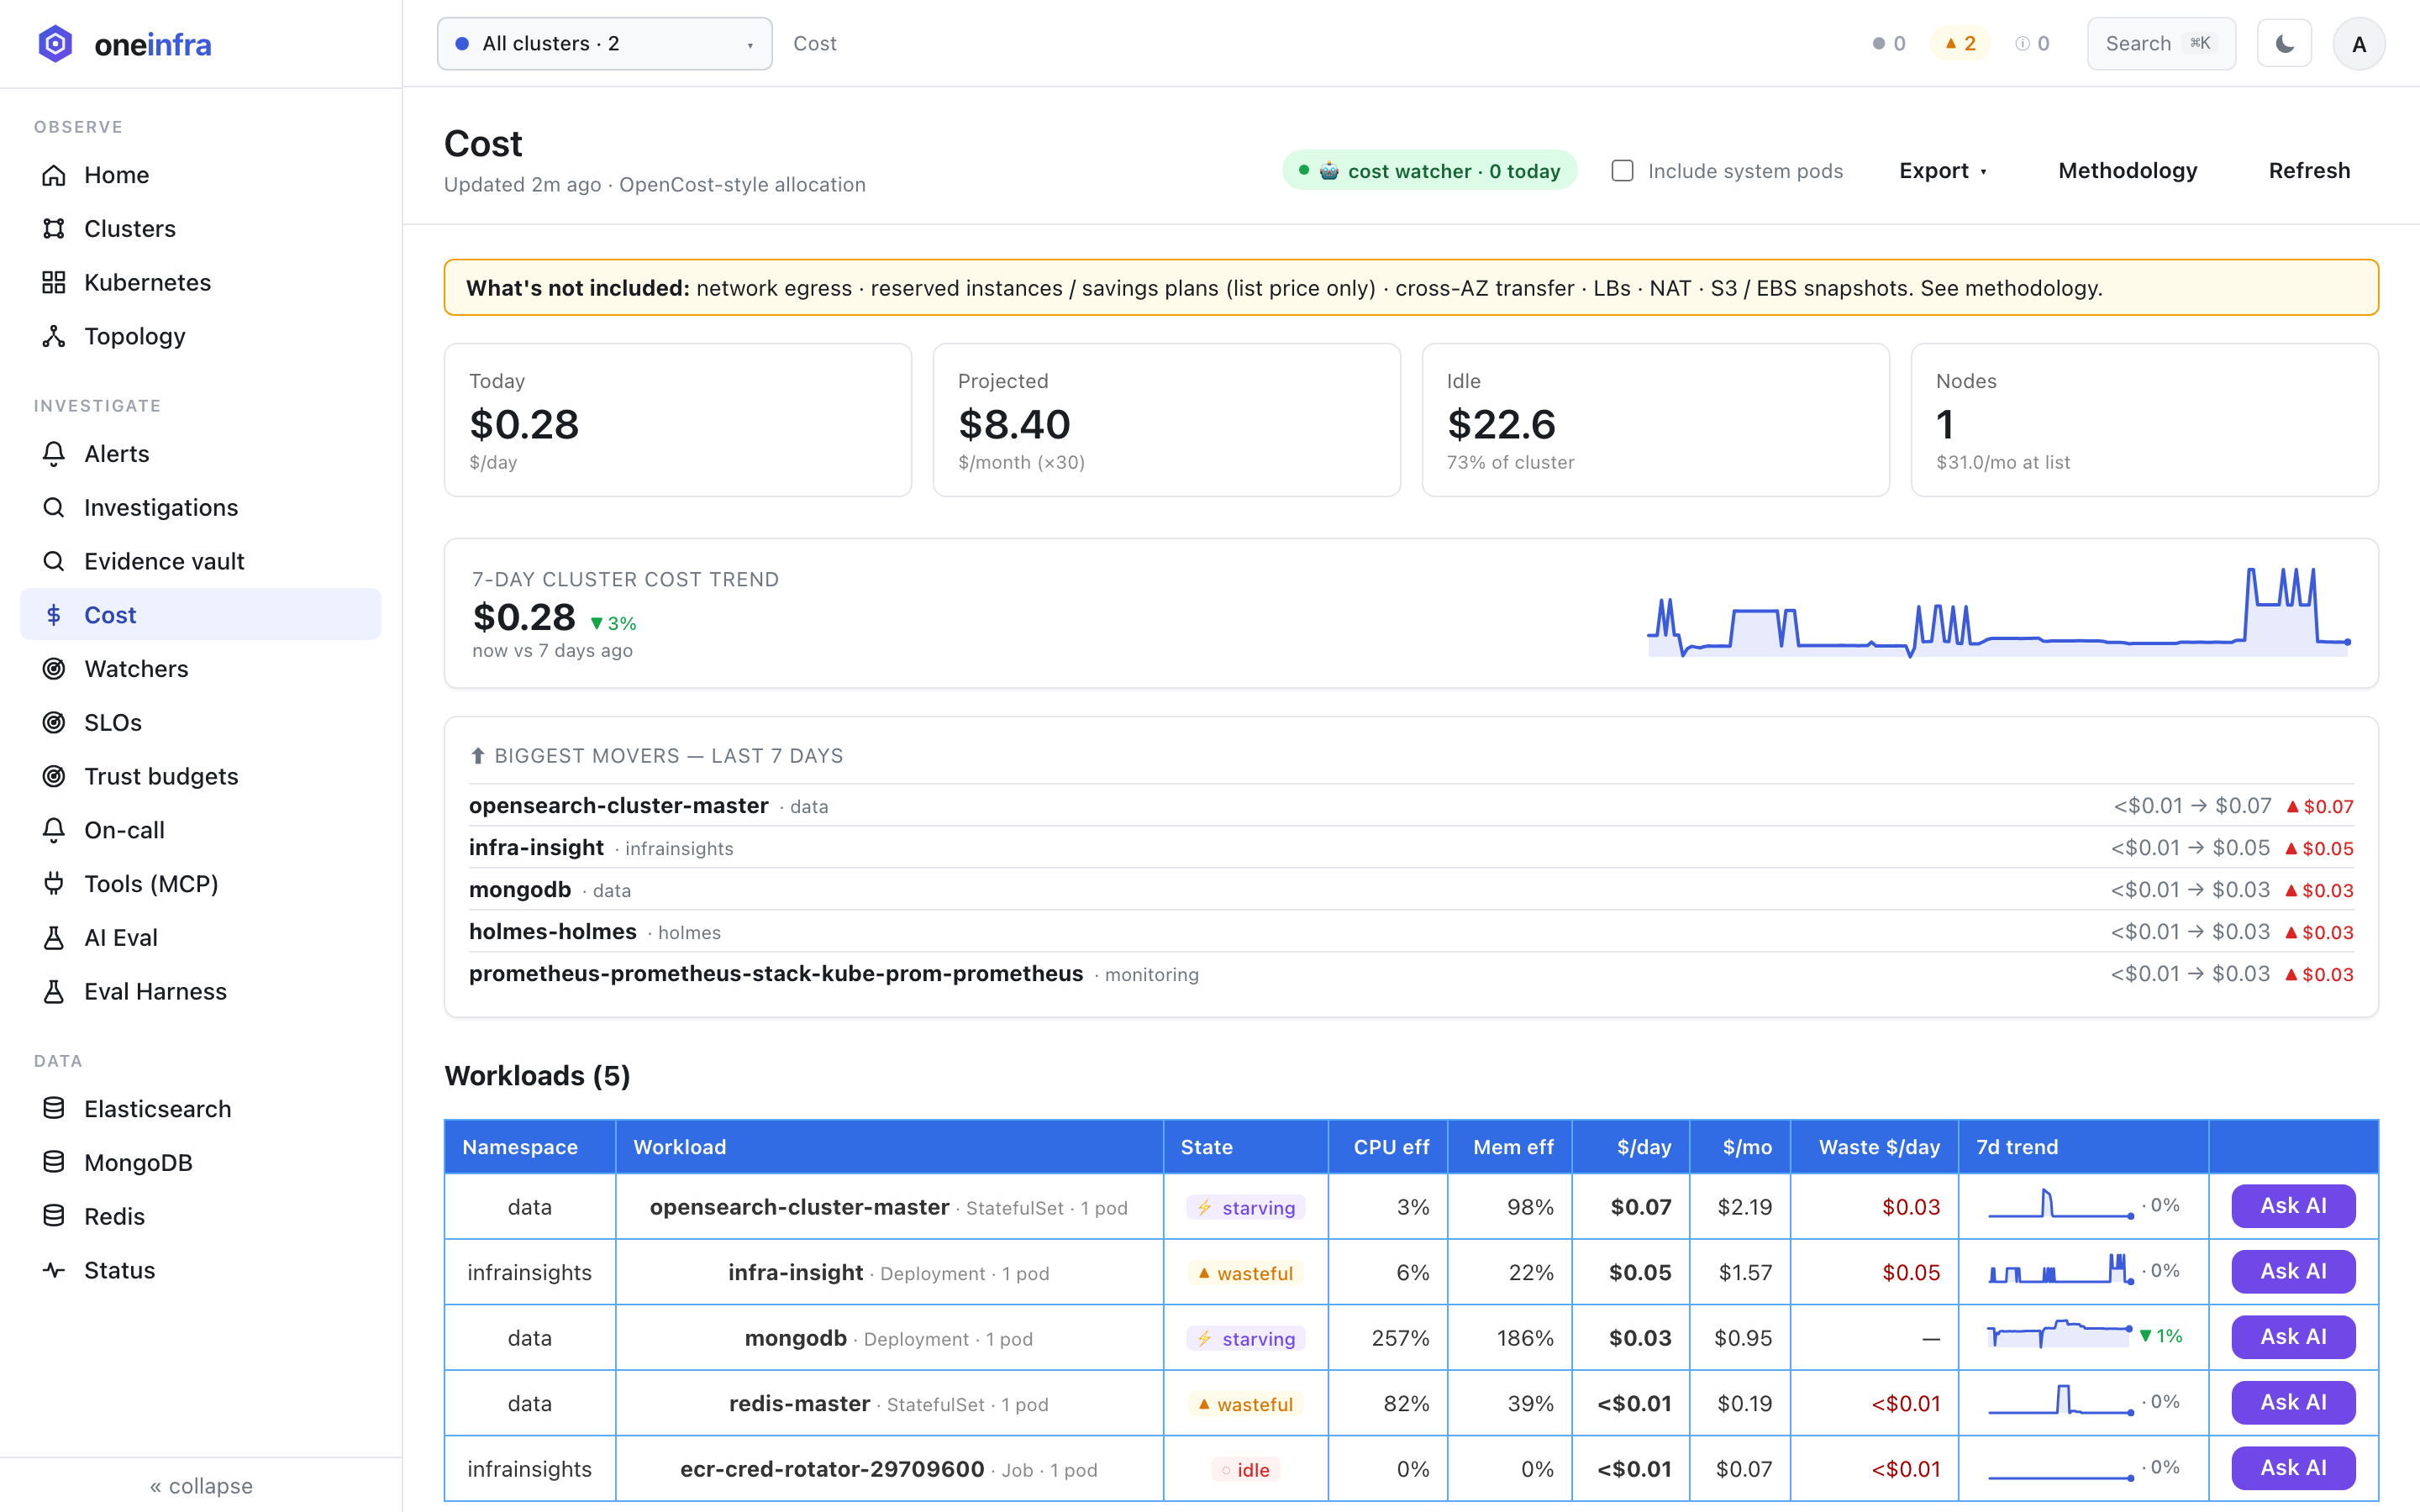
Find the 73% you're paying for and not using.
OpenCost-style allocation, per workload, with CPU/memory efficiency, idle spend, and a 7-day trend. oneinfra labels what's starving and what's wasteful — and the AI tells you what to set it to.
- Per-namespace, per-workload allocation with waste in dollars
- Idle %, biggest movers, and projected monthly spend
- "Ask AI" on any row for a right-sizing recommendation
- A cost watcher that flags new spend before the invoice does
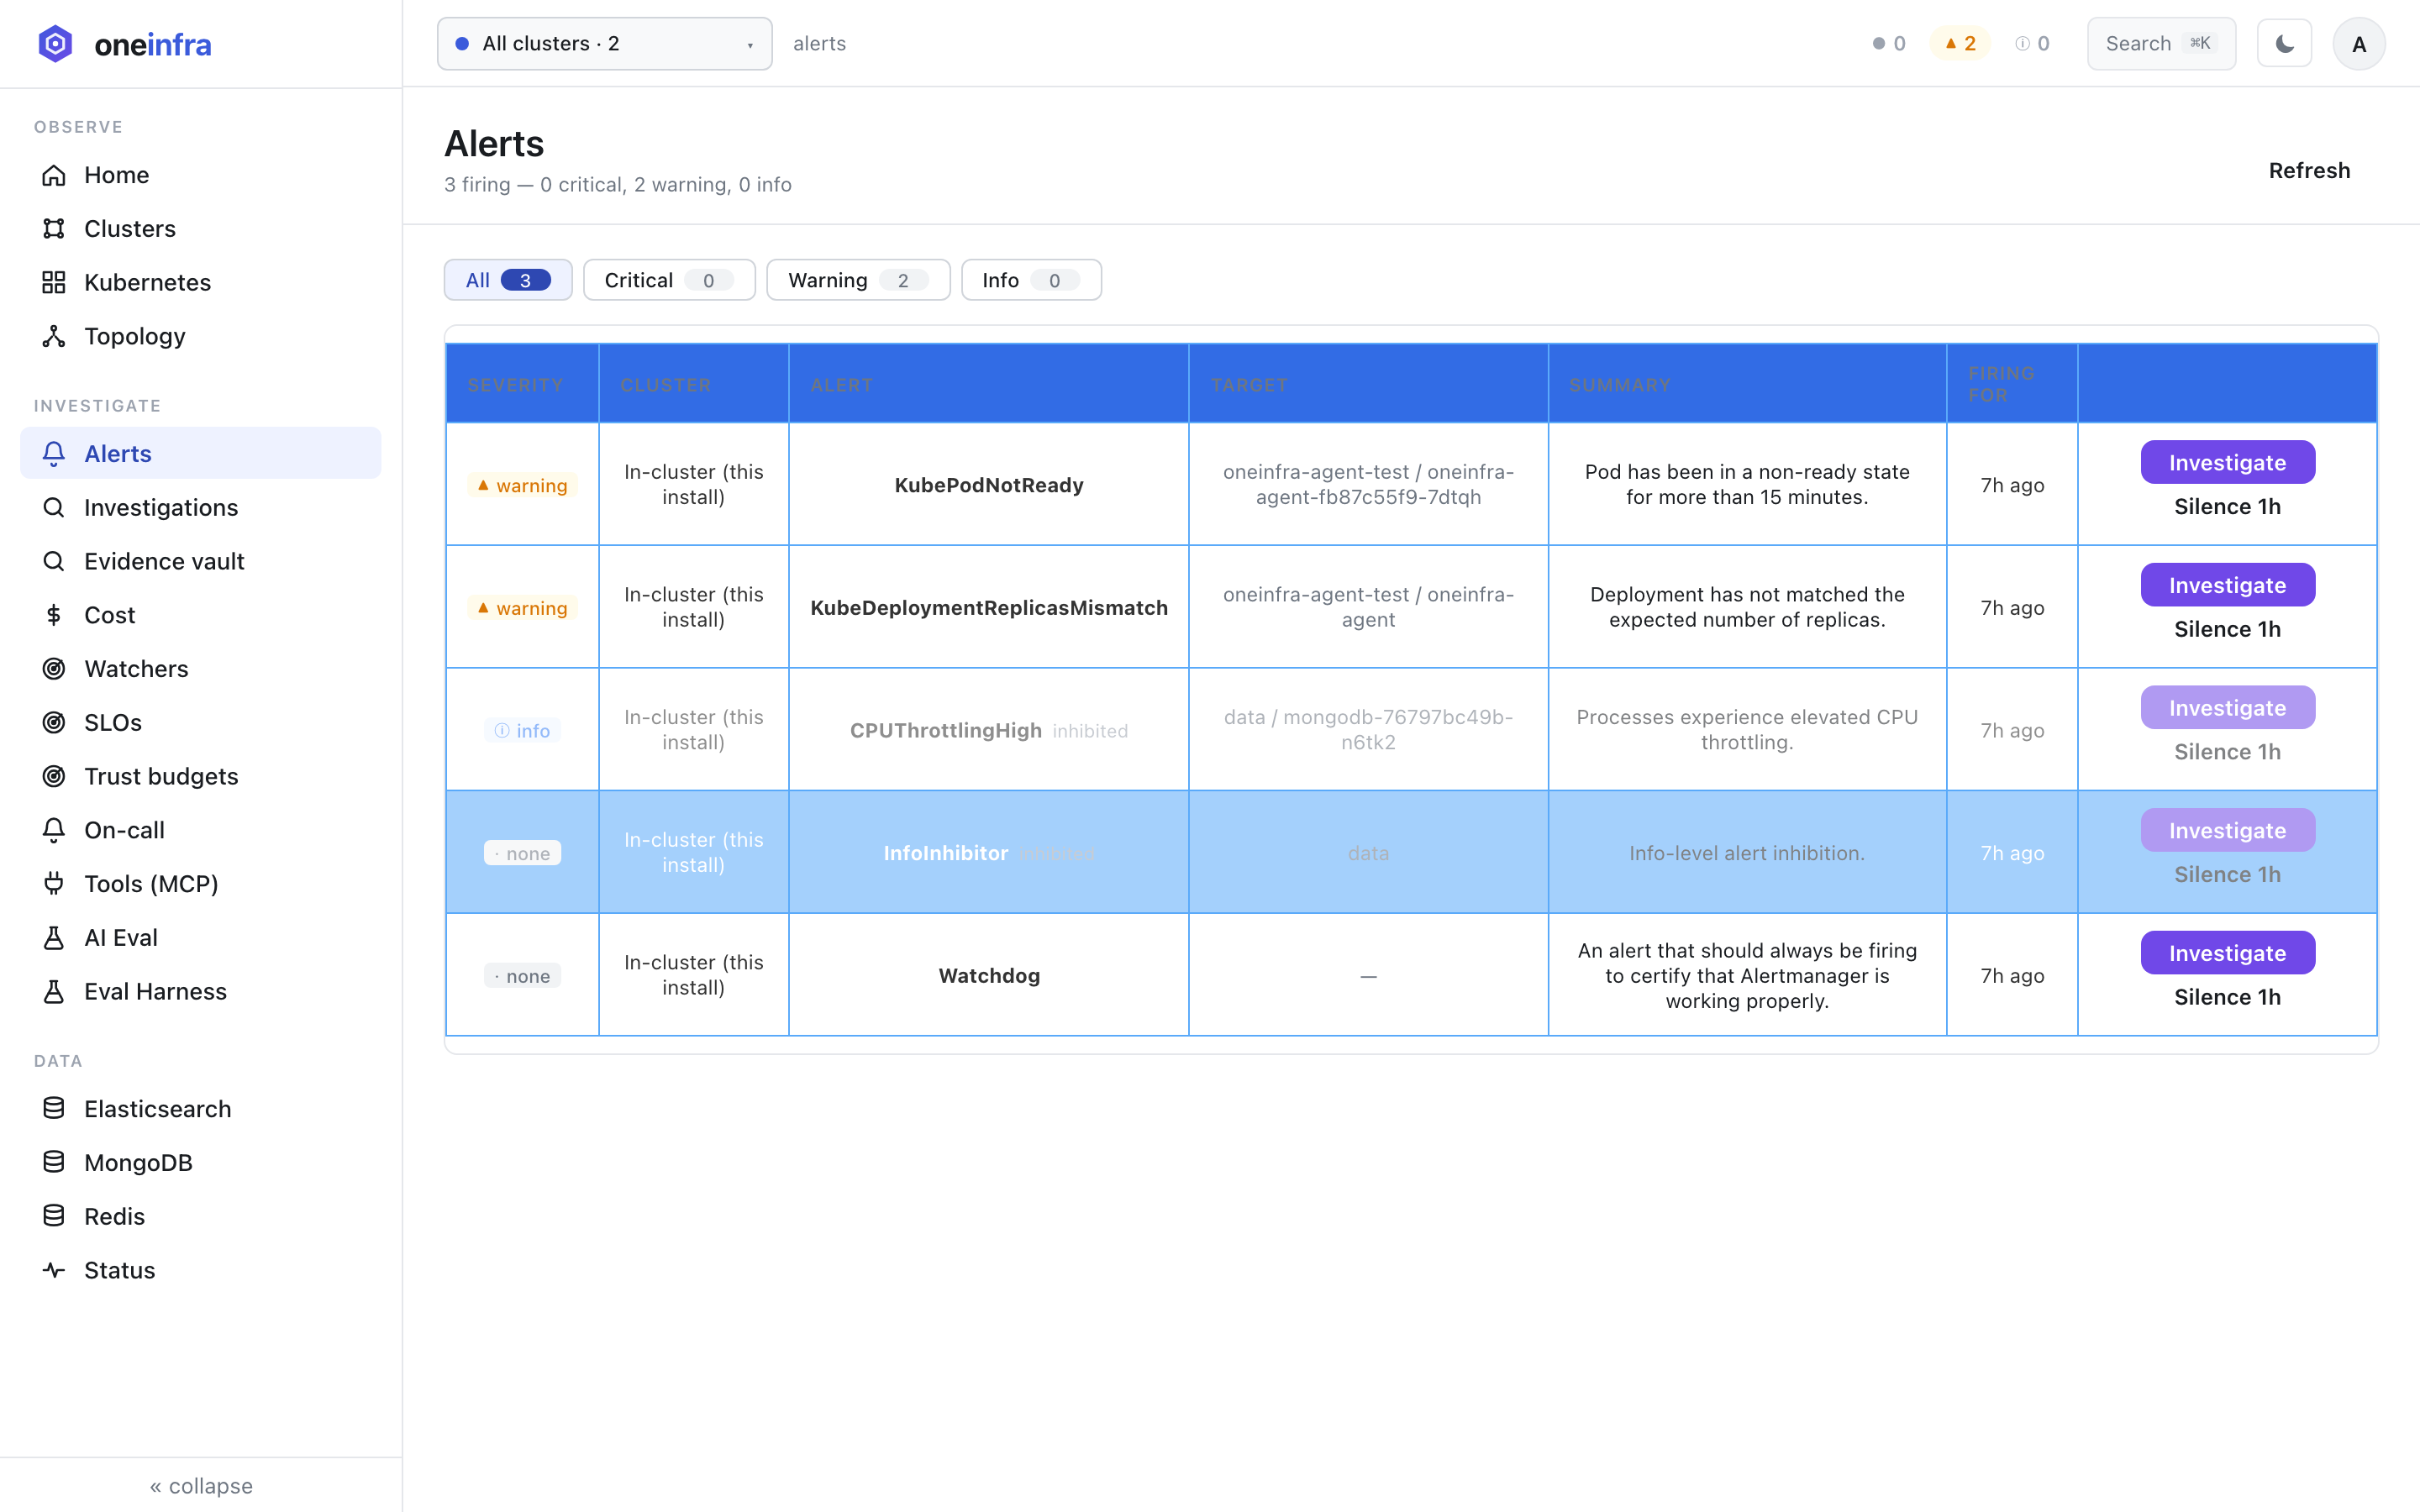
Wake up to answers, not alerts.
Every Prometheus and Alertmanager alert arrives pre-investigated. oneinfra correlates the noise, ranks likely cause, and attaches the evidence — so the human work is approval, not archaeology.
- One-click investigate on any firing alert
- Severity-aware grouping that cuts alert noise
- Silence, escalate, or remediate from the same view
One install. No code changes.
Install the agent
A single deploy into your cluster. Read-only by default, running entirely inside your network.
Connect your stack
Point oneinfra at Prometheus, your logs, and any MCP source. It builds a live map of everything automatically.
Let the AI watch
Investigations run on every alert and on demand. You get root cause, cost, and fixes — 24/7.
Your clusters. Your data.
Your network.
Unlike SaaS AI-SRE tools, oneinfra runs inside your own VPC. Telemetry, logs, and investigations never leave your perimeter — so it clears security review instead of stalling in it.
Read the security model →-
Runs in your VPCNo data egress. Optional air-gapped LLMs for fully offline operation.
-
Read-only accessNo application data extraction. Scoped, auditable permissions.
-
SOC 2 readyTLS 1.3 in transit, AES-256 at rest, SSO/SAML and RBAC.
Why teams are picking oneinfra
No fake quotes. These are the three reasons that recur most often when prospects ask us "why you, not Resolve / Komodor / Cleric?" We'll publish named case studies as design partners go live.
SOC 2 in 30 days, not 90
Self-hosted by default clears legal and security review in days, not quarters. The VPC story is the whole conversation — your telemetry, your model, your keys.
- Data never leaves your perimeter
- Clears security review on first pass
- Optional air-gapped LLM support
One console, not five
SRE, FinOps, and on-call live in the same model of your clusters. Replaces three monitoring tools, two cost spreadsheets, and a Slack channel of broken dashboards.
- Unified topology, cost & alert view
- Replaces Datadog + Grafana + OpenCost
- Single source of truth for every team
BYO model, even offline
OpenAI, Anthropic, Bedrock, Azure, or a self-hosted model — switch with one config line. Air-gapped is a flag, not a custom build. Regulated environments end-to-end.
- Works with any LLM provider
- Air-gap mode with no egress
- Switch models with one config change
Right now on the demo cluster.
These numbers come live from the oneinfra deployment running at oneinfra.tech/oneinfra — the same instance you can click into. Auto-refreshes every 30 seconds. No marketing math.
Put an AI SRE on every cluster.
See oneinfra investigate a live incident, surface idle spend, and draft a fix — in a 20-minute walkthrough on your stack.